Market Report · Medtech Manufacturing · M&A
The Medtech Supplier Roll-Up: 276 Transactions Since 2020
A data review of 276 medtech supplier transactions since 2020: who is transacting, what is being bought, and what the deal count does and does not establish.
Since 2020, private equity has been quietly rolling up the medtech supplier base. We built the database to see how far it has gone. The whole picture, before the detail:
- 276 supplier transactions since January 2020. Contract manufacturers, CDMOs, component and material suppliers, product-development firms, and testing and regulatory labs.
- About 63% involved a private-equity or venture-backed acquirer or platform. Sponsor-led platform-building, not strategics buying strategics.
- 35% were bolt-on add-ons, and 31 were corporate carve-outs. Deliberate roll-up construction, not opportunistic buying.
- Volume rose from 29 deals in 2020 to 58 in 2025, but not in a straight line. A real slowdown from the 2021 peak through 2024, then a rebound.
- A short list is doing most of it. Platforms like Resonetics, Arterex, Vance Street, NAMSA and Veranex. Sponsors like GTCR, Investindustrial, ArchiMed and Carlyle.
- One honest limit. A deal count measures activity, not market concentration. It shows the checkbook is open, not that the supplier pool has shrunk.
The takeaway: financial sponsors are consolidating the outsourced supply base faster than a decade ago, though unevenly. If you build devices, more of your suppliers now answer to a platform owner. If you are a supplier, you are on someone's list.
Method
What we counted
A "transaction" here is any change of control or significant investment in a medical-device supplier: whole-company acquisitions, platform add-ons (bolt-ons), corporate carve-outs, mergers, majority and minority investments, recapitalizations, and take-privates. Because the set spans these structures, we use "transactions" rather than "acquisitions" throughout.
- Scope. Suppliers to medical-device OEMs: contract manufacturing and CDMO services, components and materials, product design and development, and testing/regulatory/CRO services. Pharma-only CDMOs, pure-software and digital-health companies, and OEM-brand-buys-OEM-brand deals are excluded unless a supplier is the target.
- Geography. Global, with roughly three-quarters (74%) of targets headquartered in the United States.
- Timing. Counted by announcement date. Cancelled transactions are excluded.
- "PE-/VC-backed." Means a private-equity or venture sponsor was involved on the acquirer or platform side at announcement. It does not imply the sponsor controlled the target beforehand.
- Nature of the figure. Built from public sources (see Sources, below). It reflects deals that are findable in public records and is best treated as a floor, not a census.
Volume
Transaction volume over time
Annual counts rose overall from 2020 to 2025, but not every year. Activity peaked early at 52 in 2021, declined to roughly 35 in 2023 and 2024, then rebounded to 58 in 2025. Through July, 2026 stands at 25, which annualizes to approximately 43: above 2023 and 2024, but below the 2021 and 2025 peaks.
| 2020 | 2021 | 2022 | 2023 | 2024 | 2025 | 2026 YTD | |
|---|---|---|---|---|---|---|---|
| Transactions | 29 | 52 | 42 | 35 | 35 | 58 | 25 |
276 transactions total. 2026 is year-to-date through July (25 recorded; annualizes to ~43). Counts reflect deals findable in public sources.
Longer view
The prior twelve years
To place the recent period in context, we ran the same bottoms-up count for the twelve years before 2020, using the same scope and sources. Grouped into six-year eras, recorded volume rose from 59 (2008 to 2013) to 124 (2014 to 2019) to 251 (2020 to 2025).
| Six-year era | Recorded transactions | Per year |
|---|---|---|
| 2008 to 2013 | 59 | ~10 |
| 2014 to 2019 | 124 | ~21 |
| 2020 to 2025 | 251 | ~42 |
Same scope and sources across eras. Earlier eras are less completely documented; see the caveat below. Counts are floors, not censuses.
One important caveat runs the other way from the headline. Older transactions had far less digital and trade-press coverage, so the earlier counts are more likely undercounted than the recent ones. If the true 2008-to-2019 figures were higher than recorded, the increase to 251 would be less steep than the raw series implies. The data still indicate a meaningful rise in activity over the period; the precise magnitude of the long-run acceleration should be read as uncertain, and probably somewhat overstated by the recorded counts.
Participants
Who is transacting
Two different kinds of actors show up in the data, and they are counted separately. Operating platforms are companies that acquire other companies. Financial sponsors are the investment firms behind those platforms, and a single sponsor's total can span several distinct, otherwise-unrelated portfolio companies, so a sponsor ranking is not comparable to a company ranking.
| Operating platform | Transactions | Backing |
|---|---|---|
| Resonetics | 12 | Carlyle + GTCR |
| Arterex | 11 | Investindustrial |
| NAMSA | 9 | ArchiMed |
| Veranex | 8 | Summit Partners |
| Integer Holdingspublic | 5 | Public company |
| Cirtec Medical | 5 | 3i Group |
The financial sponsors behind those platforms, ranked by how many medtech-supplier transactions they were involved in, are shown below. Switch to the Data view for the segment breakdown of each sponsor's portfolio.
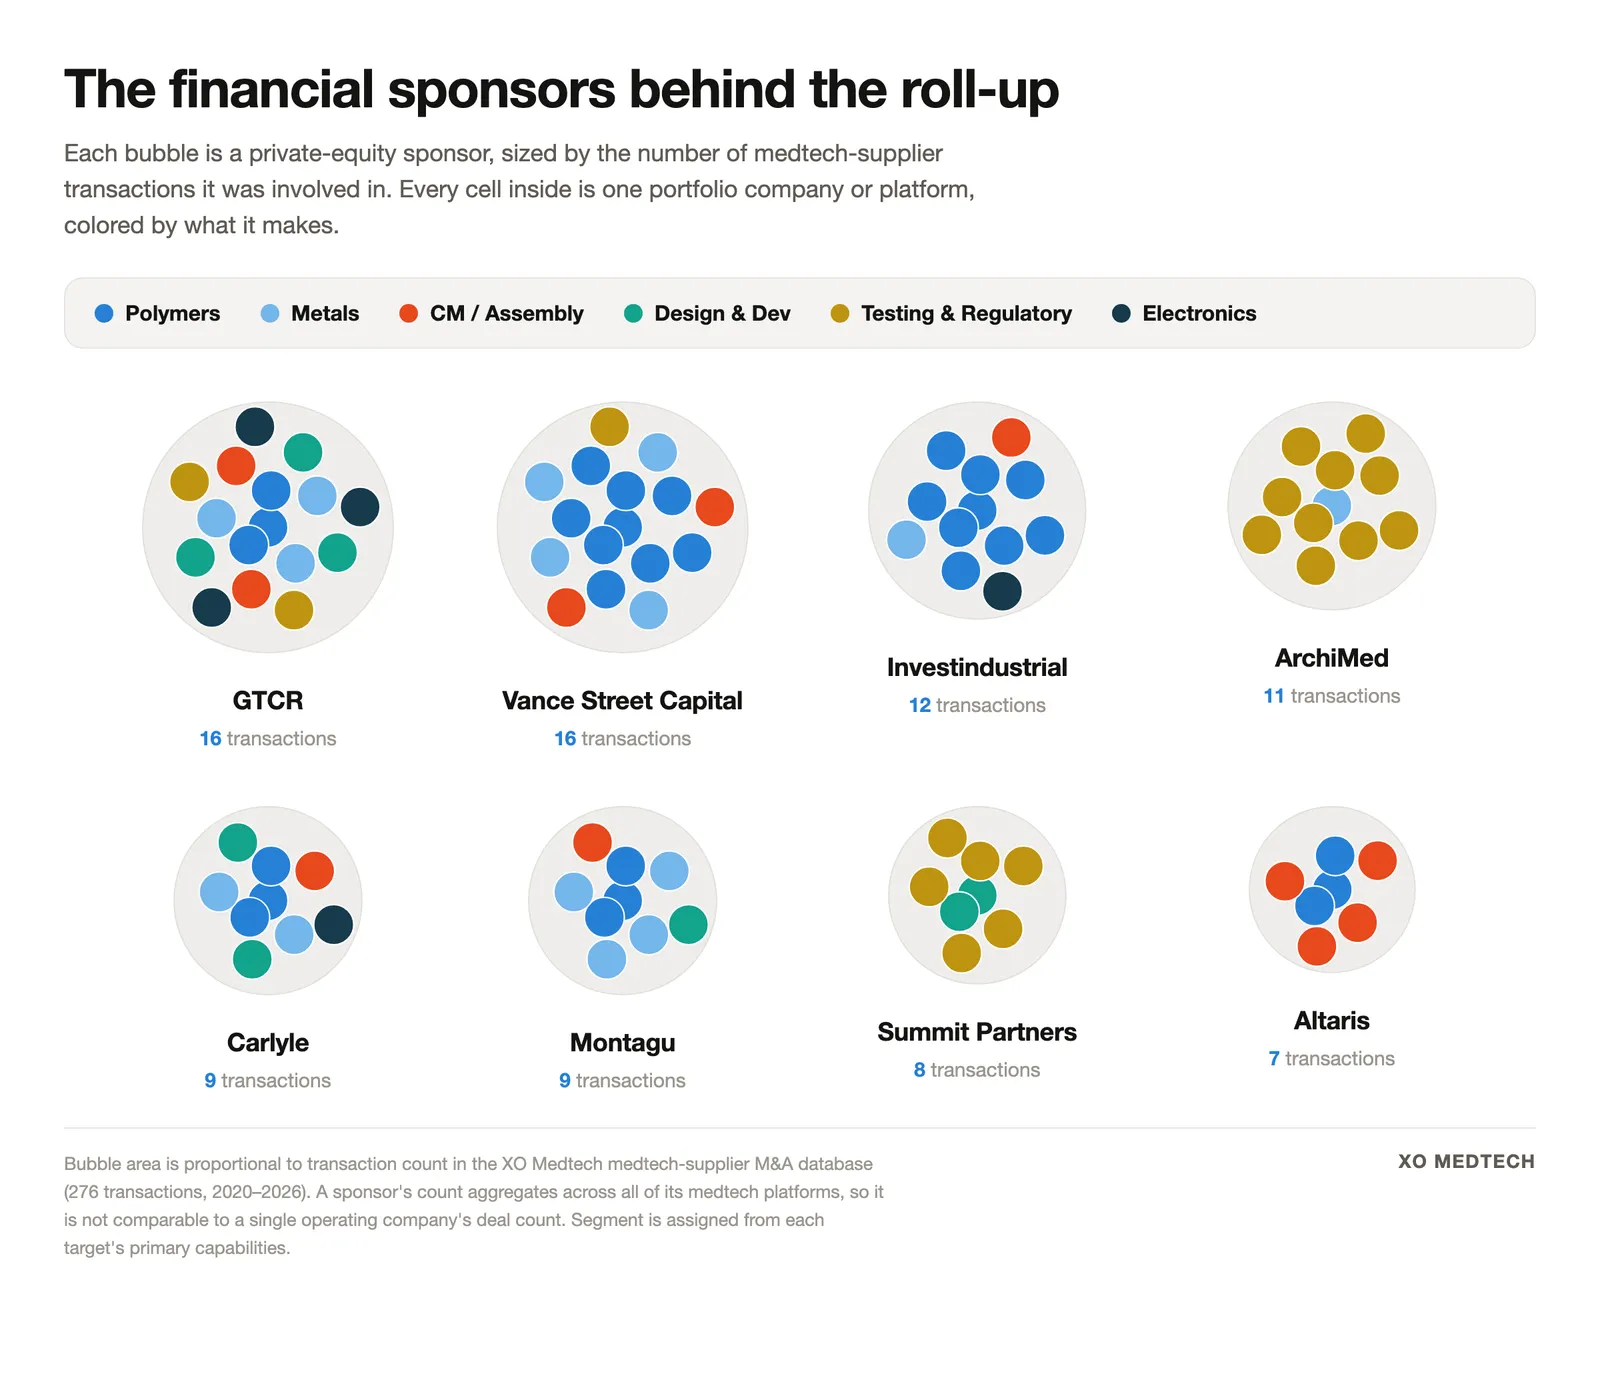
| Sponsor | Transactions | Polymers | Metals | CM / Assembly | Design & Dev | Testing & Regulatory | Electronics |
|---|---|---|---|---|---|---|---|
| GTCR | 16 | 3 | 3 | 2 | 3 | 2 | 3 |
| Vance Street Capital | 16 | 9 | 4 | 2 | 0 | 1 | 0 |
| Investindustrial | 12 | 9 | 1 | 1 | 0 | 0 | 1 |
| ArchiMed | 11 | 0 | 1 | 0 | 0 | 10 | 0 |
| Carlyle | 9 | 3 | 2 | 1 | 2 | 0 | 1 |
| Montagu | 9 | 3 | 4 | 1 | 1 | 0 | 0 |
| Summit Partners | 8 | 0 | 0 | 0 | 2 | 6 | 0 |
| Altaris | 7 | 3 | 0 | 4 | 0 | 0 | 0 |
A sponsor's count aggregates across all of its medtech platforms and may involve several unrelated portfolio companies, so it is not comparable to a single operating company's count. Segment is assigned from each target's primary capabilities.
The five most active operating platforms account for 45 of 276 transactions, about 16%. That is a meaningful rate of repeat activity for individual acquirers, but it is not, on its own, evidence that a small number of companies control the broader supplier base.
Structure
What kind of transactions these are
The set is not uniform. Whole-company acquisitions are the single largest category but a minority of the total; platform add-ons are nearly as common.
| Structure | Count | Share |
|---|---|---|
| Whole-company acquisition | 101 | 37% |
| Platform add-on (bolt-on) | 97 | 35% |
| Corporate carve-out | 29 | 11% |
| Majority investment | 21 | 8% |
| Merger | 13 | 5% |
| Recapitalization | 6 | 2% |
| Take-private | 5 | 2% |
| Other (IPO, minority) | 4 | 1% |
The prominence of add-ons and carve-outs is what distinguishes this period from ordinary corporate M&A: it is consistent with sponsor-led platform-building, in which a platform is assembled from smaller pieces and strategics divest non-core units.
Values
The largest disclosed transactions
A handful of transactions are far larger than the rest, but they differ in structure and in how their values were reported. They are not directly comparable, and two of the largest involve companies whose medtech exposure is only partial: Element is a broad testing, inspection and certification group, and Cantel was primarily an infection-prevention products and services company.
| Transaction | Structure | Reported value | Basis | Disclosed? |
|---|---|---|---|---|
| Temasek / Element MaterialsTIC group | Take-private | ~$7.0B | Reported valuation | Not officially disclosed |
| STERIS / Cantel Medical | Full acquisition | ~$3.6B equity / ~$4.6B EV | Equity & enterprise value | Disclosed |
| EQT / Zeus Company | Full acquisition | ~$3.4B | Reported EV incl. debt | Not officially disclosed |
| Carlyle / Resonetics | Minority recapitalization | $2.25B | Total company valuation | Disclosed |
| AMETEK / Paragon Medical | Full acquisition | ~$1.9B | Transaction value | Disclosed |
| DuPont / Spectrum Plastics | Full acquisition | $1.75B | Purchase price | Disclosed |
Values as reported by the parties or reputable trade press. The Resonetics figure is a company valuation associated with a minority recapitalization, not a purchase price for the whole company. Element and Zeus values were reported but not officially disclosed by the parties.
Composition
What is being bought
The most frequently represented capabilities and clinical areas among acquired suppliers are shown below. These are tag counts, and a single supplier commonly serves several capabilities and markets, so the categories overlap and do not sum to the total. They indicate where deal activity appears most often; they are not a market-share measurement.
| Capability | Transactions | Clinical area | Transactions |
|---|---|---|---|
| Finished-device assembly | 78 | Drug delivery | 78 |
| Injection / micro-molding | 55 | Diagnostics / IVD | 65 |
| Design & engineering | 47 | Interventional cardiology | 64 |
| Metals / machining | 37 | Surgical / laparoscopic | 58 |
| Sterile packaging | 27 | Peripheral vascular | 48 |
| Regulatory & QA | 24 | Neurovascular / structural heart | 66 |
Tags are assigned per transaction from public descriptions of the target; a transaction may carry several capability and clinical tags. Counts therefore overlap and should be read as frequency of appearance, not exclusive shares.
Design
Product-development and design-engineering firms
Twenty-eight of the 276 transactions involve firms we classify as product-development or design-engineering companies, the front end of the outsourced value chain. Several were folded into concept-to-commercialization platforms: Ximedica became part of Veranex; StarFish Medical acquired Omnica Corporation; and Sterling Medical Devices merged with RBC Medical Innovations in a transaction led by Ampersand Capital Partners, with the combined company rebranded Vantage MedTech.
Size
Target size
Deal-era employee counts were disclosed for 49 of the 276 transactions. Among that subset, the median target had approximately 500 employees, with a range from roughly 30 to several thousand. This is an estimate drawn from the minority of deals that disclosed headcount, not a verified median across the full set, and it should be read with that sampling limitation in mind.
Limits
Limitations
- Count is not concentration. These figures measure transaction activity, not market structure. They do not establish how much supplier revenue, manufacturing capacity, or how many independent facilities the largest platforms control, and they are not offset against new supplier formation. Statements about the market "consolidating" require those additional measures, which this dataset does not contain.
- Floor, not census. The count reflects publicly findable deals; smaller and non-U.S. transactions are undercounted, more so in earlier years.
- Overlapping tags. Capability and clinical figures are non-exclusive per-transaction tags, not partitions of the total.
- Definitional edges. "PE-/VC-backed," "supplier," and the boundary between an add-on and a new platform each involve judgment calls that affect counts at the margin.
Our take
Sponsor-backed platform-building has been a sustained, dominant mode of activity in medtech's outsourced supply base for the better part of two decades, and it accelerated in the current period even accounting for the mid-cycle slowdown. Strategics remain important buyers (STERIS, AMETEK and DuPont each made large acquisitions in the set), but the volume is carried by financial sponsors assembling capability-complete platforms from smaller specialists.
For OEMs, the practical implication is that a supplier used for one operation may now sit inside a larger platform with its own roadmap and ownership clock. That is often useful (integrated design-through-manufacturing under common ownership), but it is worth weighing the concentration of a critical operation with a single owner, and revisiting dual-sourcing where a part is hard to move. We would not overstate this: acquired sites frequently retain their own certifications and registrations through long integration periods, so "one owner" does not immediately mean "one quality system."
The integration of recently acquired assets, across sales, operations, technology infrastructure, quality management, ERP, and other critical data-layer elements, is a real and present challenge for many post-merger organizations and their executive leadership teams. Companies that have been through a merger or acquisition often operate effectively detached from one another for years after the transaction, which leaves economies of scale, cross-selling, and other points of leverage untapped.
For suppliers, the choice is not a binary between selling and scaling. The data show platforms paying up for capability-complete assets, which is a real reason for a well-positioned specialist to consider a process on its own terms. But independence remains viable through specialization, defensible process expertise, automation, geographic focus, or partnership; the roll-up is a strong current, not the only path.
The clearest finding is simply that the activity is real, sponsor-led, and larger than a single cycle. Whether it has meaningfully concentrated the market by revenue or capacity is a further question these deal counts raise but do not answer.
Sources & method
Individual transactions were identified and cross-checked primarily against:
- Company and financial-sponsor announcements. The acquirer's, target's, or sponsor's own press releases and newsrooms, which are the primary record for most deals.
- SEC filings. 10-K, 8-K and proxy statements for the publicly traded acquirers in the set (for example Integer Holdings, AMETEK, STERIS, Novanta, IntriCon).
- Medtech trade press. Medical Product Outsourcing (MPO), Medical Design & Outsourcing, MassDevice and MedTech Dive, including their annual M&A reviews.
- Private-equity trade press. Outlets covering sponsor and platform activity, used to corroborate ownership and deal structure.
- Public regulatory and clinical databases. U.S. FDA clearance and approval records, NIH grant records and clinical-trial registries, used to confirm what the companies make and to keep the scope to genuine device suppliers.
- Firmographic references. For employee-count and headquarters context where disclosed.
Transaction values are stated as reported by the parties or reputable trade press; where a value was reported but not officially confirmed by the parties, it is labeled accordingly. Figures reflect deals findable in these public sources and are best treated as a floor.